
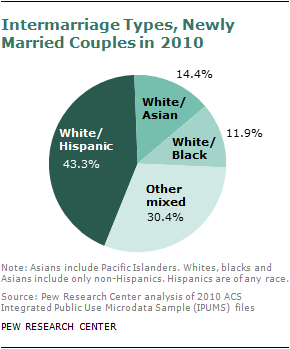

1. Most intermarriages happen between whites and non-whites in the U.S.. In 2010, seven-in-ten (70%) new intermarriages involved a white spouse. The most common pairings were between whites and Hispanics. They accounted for more than four-in-ten new intermarriages in 2010. The share of White/Asian couples was 14%, and white/black couples 12%.
2. Asian Americans has one of the highest intermarriage rates. In 2010, 28% of newly married Asians “married out,” compared with 26% of Hispanic newlyweds, 17% of black and 9% of white newlyweds. If we look at all currently married couples (regardless of when they got married), the intermarriage rate is 15% for Asians, 18% for Hispanics, 10% for blacks and 5% for whites. The Asian intermarriage rate has gone down somewhat in recent years.
3. Black men are more than twice as likely as their female counterparts to marry a non-black spouse, but the reverse gender pattern is true among Asian Americans. In 2010, nearly one quarter of black male newlyweds (24%) married outside their race, compared with just about 9% of black female newlyweds. In contrast, more than one-in-three (36%) Asian female newlyweds in 2010 married someone who is non-Asian, compared with only about one-in-six Asian male newlyweds (17%).
4. “Marrying out” is much more common among the native-born population than among immigrants. Native-born Hispanics were nearly three times as likely as their foreign born counterparts to marry a non-Hispanic in 2010.The disparity among native and foreign-born Asians is not as great, but still significant: More than one-in-three (38%) native-born Asians and nearly a quarter (24%) of foreign-born Asians married a non-Asian in 2010.
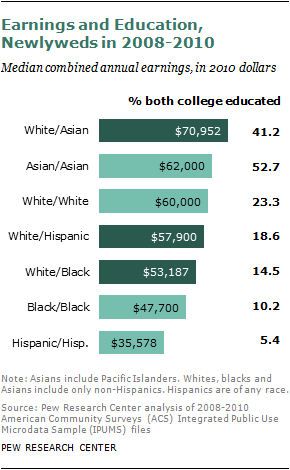
5. White/Asian intermarried couples have the highest earning power. The combined median earnings of white/Asian newlywed couples are nearly $71,000, much higher than earnings of white/Hispanic couples (about $58,000) and white/black couples (about $53,000). White/Asian couples have higher combined earnings than do white/white or Asian/Asian couples.
Much of the earning gaps among couples can be linked to educational differences. In about four-in-ten intermarried white/Asian newlyweds (41%) both husband and wife are college educated, compared with 23% of white/white couples, 19% of white/Hispanic couples, and 15% white/black couples. (Asian/Asian couples are the most educated, but their combined earnings are somewhat lower than white/Asian couples).
6. First-time newlyweds (for both bride and groom) made up about 58% of all newly married couples between 2008 and 2010. About one-in-five (20.5%) new marriages were for couples that both bride and groom have been married before, and the rest involved one married before, one not.
The vast majority of Asian and Hispanic couples who “married in” are the first time newlyweds (79% and 68%). The rate for intermarried white/Hispanic and white/Asian couples is lower, about six-in-ten (59%). First-time marriage rate for white/white couples is slightly lower (55%), and a similar rate applies to black couples and intermarried white/black couples (about 54%).
7. Intermarriage in the Unites States tilts West. About one-in-five (22%) of all newlyweds in Western states married someone of a different race or ethnicity between 2008 and 2010, compared with 14% in the South, 13% in the Northeast, and 11% in the Midwest.
At the state level, more than four-in-ten (42%) of newlyweds in Hawaii between 2008 and 2010 were intermarried; the other states with an intermarriage rate of 20% or more are all situated west of the Mississippi River. For marriages between whites and Hispanics, the three states with the highest prevalence rates are New Mexico (19%), Arizona (12%) and Nevada (11%). The highest shares of intermarried white and Asian couples are in Hawaii (9%), District of Columbia (7%), and Nevada (5%). And the top three states for white/black intermarried couples are: Virginia (3.3%), North Carolina (3.2%) and Kansas (3.0%).
