Time and Life

by Wendy Wang


Leave a comment

The link between a college education and a lasting marriage

Originally posted on Pew Research Center “Fact Tank.”

ft_15-12-4-college-marriage2About half of first marriages in the U.S. are likely to survive at least 20 years, according to government estimates. But for one demographic group, marriages last longer than most: College-educated women have an almost eight-in-ten chance of still being married after two decades.

Researchers at the National Center for Health Statistics estimate that 78% of college-educated women who married for the first time between 2006 and 2010 could expect their marriages to last at least 20 years. But among women who have a high school education or less, the share is only 40%.

The probability of a lasting first marriage is derived from marital history data from the National Survey of Family Growth, a nationally representative sample of women and men who were ages 15 to 44 between 2006 and 2010. Estimates are based on an approach similar to that used to determine life expectancy and assume that marriage patterns in the future will follow patterns today. The findings refer only to opposite-sex marriages; the sample size was too small to analyze same-sex marriages.

Reasons for marriages ending include divorce and separation. Marriages that ended in death were not included in the analysis. One limitation of the survey was that it did not include adults over age 44 and therefore does not take into account long-term marriages that started later in life. And adults with advanced degrees were not separately analyzed because of the small sample size.

The findings are yet further evidence of the marriage gap in the U.S. along educational lines. College-educated adults are more likely to be married than less-educated adults. Among those who were ages 25 and older in 2014, 65% of those with a bachelor’s degree or more were married, compared with 53% of adults with less education, according to a Pew Research Center analysis.

While the research does not address reasons these marriages last longer, we do know college-educated adults marry later in life and are more financially secure than less-educated adults.

While more-educated women have the highest chances for a long-term marriage, college-educated men also stand out. Roughly two-thirds (65%) of men with a bachelor’s degree could expect that, if they marry, their first marriage will last 20 years or longer, compared with 50% of men with a high school diploma or less. In addition, men with a higher level of education are more likely to get married in the first place when compared with less-educated men.

ft_15-12-03-race_-marriageThere also are distinctive patterns in marriage longevity by race and ethnicity. Some of these differences could be related toeducational differences among adults with different racial or ethnic backgrounds. Asian women, who are among the most educated, are more likely than any other racial or ethnic group to have a long-term marriage. For Asian women who were married for the first time between 2006 and 2010, the chance that they may celebrate their 20-year wedding anniversary is nearly 70%. By contrast, about half of Hispanic and white women may see their marriages last that long. And for black women, the chance is 37%.

Among men, Hispanics have the highest likelihood of being in a long-lasting marriage (findings about Asian men are not included because the sample size was too small to be nationally representative). For those who married for the first time between 2006 and 2010, about six-in-ten Hispanic men (62%) could expect their marriages to last at least 20 years, compared with 54% of white men and 53% of black men.

ft_15-12-03-cohabitation-marriageAnother factor linked to long-lasting marriages is whether couples live together before tying the knot. In short, couples who lived together before getting married had a slightly lower chance of having a long-term marriage than those who did not live together.

Among women who did not live with their spouse before getting married for the first time, 57% can expect to still be married after 20 years. For women who lived with their spouse before marriage, the probability of being married for at least 20 years is somewhat lower – 46%. Whether the couple was engaged when they lived together didn’t make a difference in women’s chances of long-lasting marriages.

For men, the patterns are slightly different. In this case, it matters whether men are engaged to a partner they lived with before getting married. Men who lived with their future spouse without being engaged had a slightly lower chance of having a long-term marriage (49%) than those who were engaged first (57%). Men who didn’t live with their partner before getting married had a 60% chance of celebrating their 20th anniversary.


Leave a comment

The best and worst cities for women looking to marry

Originally posted on Pew Research Center “Fact Tank.”

Young adults who would like to get married naturally start looking for love in the community they live in, but in some parts of the country, the odds may be against them. A new Pew Research Center analysis finds pronounced differences in the ratio between men and women living in the largest U.S. metro areas, especially when it comes to singles who have an attractive characteristic: a job.

Our poll published earlier found that half (53%) of never-married Americans would like Top 10 Large Metro Areas With Highest Ratios of Employed Single Young Men to Single Young Women
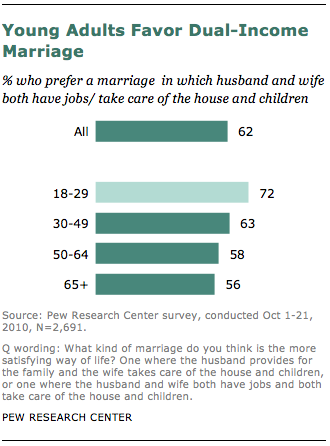
to eventually tie the knot. And among never-married women interested in marriage, 78% said that it is “very important” to them that a potential spouse has a steady job (only 46% of never-married men said the same). Looking at the most recently available census data, we explored the demographics of the “marriage market” based on what women said they want in a spouse.

Nationwide, single young men outnumber their female counterparts. The overall male-to-female ratio is 115:100 among single adults ages 25 to 34. But when we limit the young men to those who are currently employed, the ratio falls to 84 employed single men for every 100 single women. (We count both young adults who have never been married and those who have been previously married as single or unmarried.)

So, which large metro areas have the best “marriage market”? For women seeking a male partner with a job, our analysis found that San Jose, Calif., tops the list among large metro areas, with 114 single employed men for every 100 single women. Among all single young adults, there were 141 men for every 100 women in this area. Over half (57%) of young adults ages 25 to 34 in the metro area, which includes Sunnyvale and Santa Clara, were single in 2012.

(Our Mapping the Marriage Market interactive displays the results of all available U.S. metro areas, as well as the reverse ratios of employed women to men and all men to all women.)

Also high on the list is the Denver area. The male-to-female ratio is 121:100, and the ratio of employed men to all women is 101:100. Some 56% of young adults in this area were unmarried in 2012.

10 Large Metro Areas With Lowest Ratios of Employed Single Young Men to Single Young WomenBut even in these top metro areas, young women may find it difficult to find a young single man with a job. The Orlando, Fla., metro area has a sex ratio of 128 single young men to 100 single young women, but the ratio of employed young single men to all young women is only 90:100. The ratios are similar in Pittsburgh and Los Angeles.

A smaller pool of employed men may not be good news for young women who are looking for a man with a job, but it could be good news for young single men. At the opposite end of the demographic split, we calculated a list of the largest metro areas that have the lowest number of employed young men for every 100 young women.

Memphis, Tenn., tops this list: only 59 employed young single men for every 100 young single women. Some other metro areas in the bottom ten include Jacksonville, Fla.; Detroit, Mich.; Charlotte, N.C.; and Philadelphia, Pa.

Note: The metro ranking is based on 43 metro areas with more than 100,000 unmarried young adults ages 25 to 34. You can find a more complete list of metropolitan areas on our map.


Leave a comment

Record share of wives are more educated than their husbands

My latest contribution to the Pew Research Center’s blog- Fact tank.

DN_Marry_DownIt used to be more common for a husband to have more education than his wife in America. But now, for the first time since Pew Research has tracked this trend over the past 50 years, the share of couples in which the wife is the one “marrying down” educationally is higher than those in which the husband has more education.

Among married women in 2012, 21% had spouses who were less educated than they were—a threefold increase from 1960, according to a new Pew Research Center analysis of Census data.

The share of couples where the husband’s education exceeds his wife’s increased steadily from 1960 to 1990, but has fallen since then to 20% in 2012.

The trend toward wives being more educated than their husbands is even more prevalent among newlyweds, partly because younger women have surpassed men in higher education in the past two decades. In 2012, 27% of newlywed women married a spouse whose education level was lower than theirs. By contrast, only 15% of newlywed men married a spouse with less education. Among college educated newlyweds (including those with postgraduate and advanced degrees), nearly four-in-ten women (39%) married a spouse without a college degree, but only 26% of men did so.

DN_Share_DeclinesAnother important trend has to do with marriages between spouses with similar education levels. Even though college graduates are increasingly more likely to marry each other, the overall share of couples of similar education levels is down from nearly 80% in 1960 to about 60% in 2012.

The primary reason for the decline in the share of married couples with similar education levels is that marriages between spouses with high school or less than high school education are much less common these days — the share is down from 74% of all marriages in 1960 to 24% in 2012. In addition, adults with high school or less education are much less likely to marry. The marriage rate among this group plummeted —from 72% in 1960 to 46% in 2012.

Just the opposite has occurred among college graduates. The share of couples in which both spouses have a college degree has risen steadily in recent decades. In 1960, only 3% of couples were in this group, the share rose to 22% in 2012. Marriages between spouses with some college education were on the rise until 2000 (from 3% to 12%), but have leveled off since then.

Despite the rise of marriages between spouses with college degrees, only 22% of all newlyweds in 2012 were in this type of marriage. Another 19% were between spouses with a high school diploma or less. The share was 16% for newlyweds with some college education (but no bachelor’s degree).

Does marrying someone with less education mean “marrying down” economically? Not necessarily. When we look at the newlywed women who married someone with less education, we find that a majority of these women actually “married up.” In 2012, only 39% of newlywed women who married a spouse with less education out-earned their husband, and a majority of them (58%) made less than their husband.


Leave a comment

Seven facts about intermarriage

sdt-2012-rise-of-intermarriage-05sdt-2012-rise-of-intermarriage-06sdt-2012-rise-of-intermarriage-02
1. Most intermarriages happen between whites and non-whites in the U.S.. In 2010, seven-in-ten (70%) new intermarriages involved a white spouse. The most common pairings were between whites and Hispanics. They accounted for more than four-in-ten new intermarriages in 2010. The share of White/Asian couples was 14%, and white/black couples 12%.

2. Asian Americans has one of the highest intermarriage rates. In 2010, 28% of newly married Asians “married out,” compared with 26% of Hispanic newlyweds, 17% of black and 9% of white newlyweds. If we look at all currently married couples (regardless of when they got married), the intermarriage rate is 15% for Asians, 18% for Hispanics, 10% for blacks and 5% for whites. The Asian intermarriage rate has gone down somewhat in recent years.

3. Black men are more than twice as likely as their female counterparts to marry a non-black spouse, but the reverse gender pattern is true among Asian Americans. In 2010, nearly one quarter of black male newlyweds (24%) married outside their race, compared with just about 9% of black female newlyweds. In contrast, more than one-in-three (36%) Asian female newlyweds in 2010 married someone who is non-Asian, compared with only about one-in-six Asian male newlyweds (17%).

4. “Marrying out” is much more common among the native-born population than among immigrants. Native-born Hispanics were nearly three times as likely as their foreign born counterparts to marry a non-Hispanic in 2010.The disparity among native and foreign-born Asians is not as great, but still significant: More than one-in-three (38%) native-born Asians and nearly a quarter (24%) of foreign-born Asians married a non-Asian in 2010.

5. White/Asian intermarried couples have the highest earning power. The combined median earnings of white/Asian newlywed couples are nearly $71,000, much higher than earnings of white/Hispanic couples (about $58,000) and white/black couples (about $53,000). White/Asian couples have higher combined earnings than do white/white or Asian/Asian couples.

Much of the earning gaps among couples can be linked to educational differences. In about four-in-ten intermarried white/Asian newlyweds (41%) both husband and wife are college educated, compared with 23% of white/white couples, 19% of white/Hispanic couples, and 15% white/black couples. (Asian/Asian couples are the most educated, but their combined earnings are somewhat lower than white/Asian couples).

6. First-time newlyweds (for both bride and groom) made up about 58% of all newly married couples between 2008 and 2010. About one-in-five (20.5%) new marriages were for couples that both bride and groom have been married before, and the rest involved one married before, one not.

The vast majority of Asian and Hispanic couples who “married in” are the first time newlyweds (79% and 68%). The rate for intermarried white/Hispanic and white/Asian couples is lower, about six-in-ten (59%). First-time marriage rate for white/white couples is slightly lower (55%), and a similar rate applies to black couples and intermarried white/black couples (about 54%).

7. Intermarriage in the Unites States tilts West. About one-in-five (22%) of all newlyweds in Western states married someone of a different race or ethnicity between 2008 and 2010, compared with 14% in the South, 13% in the Northeast, and 11% in the Midwest.

At the state level, more than four-in-ten (42%) of newlyweds in Hawaii between 2008 and 2010 were intermarried; the other states with an intermarriage rate of 20% or more are all situated west of the Mississippi River. For marriages between whites and Hispanics, the three states with the highest prevalence rates are New Mexico (19%), Arizona (12%) and Nevada (11%). The highest shares of intermarried white and Asian couples are in Hawaii (9%), District of Columbia (7%), and Nevada (5%). And the top three states for white/black intermarried couples are: Virginia (3.3%), North Carolina (3.2%) and Kansas (3.0%).


Leave a comment

For Young Adults, the Ideal Marriage Meets Reality

An earlier version was posted at Pew Research Center-Fact Tank blog.

young-adults-dual-income-marriage

Americans’ attitudes toward an ideal marriage have changed dramatically over the past several decades. The share of the public that favors a marriage in which husband and wife both work and take care of the house and children is up from 48% in 1977 to 62% in 2010. During the same period, the share that prefers the model of the breadwinner husband and homemaker wife is down from 43% to 30%.

Young adults are often at the forefront of changing social norms. Adults younger than 30 are most likely to favor a dual-income marriage model (72%), over the breadwinner husband-homemaker wife model (22%). This is even more true for young women, who are more likely than young men to prefer dual-income marriage (78% vs. 67%). Young adults are also more positive about the impact on families of increasing numbers of women entering the workforce.

Given young adults’ strong preference for a dual-income marriage model and their positive attitudes about working women, we might expect that they would be more likely to embrace the dual-income model when they themselves are married.

However, it’s not the case. When we took a closer look at the most recent American Community Survey data, we found that 57% of young married couples (where the wife is younger than 30) are in a dual-income marriage, compared with 62% of couples in their 30s and 40s. These young couples also are more likely than older ones to include a breadwinner husband and homemaker wife (32% do).

Dual-income-marriages-wife-ageBreadwinner-husband-homemaker-wife

Why is that? The answer appears to be related to the age of their children. More than half of young couples (57%) have children ages 5 or younger at home, compared with 30% of couples in their 30s and 40s. (Young couples in general are less likely than couples in their 30s and 40s to be parents.)

Younger children create greater time demands on their parents. According to our analysis of 2011 time diary data, overall, parents with children younger than 18 spend an average of 11 hours per week on childcare, but 15 hours per week when they have children younger than 6.

Cost of childcare is another factor. In big metro areas, good professional childcare can be expensive and it may make more economic sense to have one spouse staying at home full time than putting kids in daycare.

Even though many of today’s young couples don’t yet have the kind of egalitarian marriage they say they want, they’re closer to that ideal than their same-aged counterparts were a generation ago (in 1980). Back then, 51% of married couples under the age of 30 had dual incomes, compared with 57% now.


Leave a comment

Why is Intermarriage Important ?

Having worked on a couple of reports about intermarriage in the U.S., I get this question often: Why do we care about who marries whom?

“Intermarriage” refers to unions between people of different races or ethnicities. To many sociologists, racial and ethnic intermarriage is a barometer of racial/ethnic relations in America. Partners in a marriage accept each other as equals, and their friends/families also get a chance to mingle. Marriages across racial and ethnic lines therefore help to break down social barriers between groups. Intermarriages could also change the definition of race in this country, as more children identify themselves as multiple races . We are becoming “a nation of mutts”, as David Brooks wrote recently.

For most of this nation’s history, a majority of states had anti-miscegenation laws that made it illegal for whites and nonwhites to marry. The first such laws were passed in the 1600s to prevent freed Black slaves from marrying Whites, as well as  biracial children of white slave owners and African slaves from inheriting property. As Asian Immigrants came to the U.S. in the 1700s and 1800s, anti-miscegenation laws were passed to prohibit Asians from marrying Whites.

The effects of these laws were far-reaching. For example, earlier Chinese immigrants were mostly young single men. They were not allowed to bring women from their country to the U.S. (if they got married). Many of them returned to China, and those who stayed rarely got married and had offsprings.

After World War II, many states repealed these laws. It was in 1967, during the height of the civil Rights Movement, the U.S. Supreme Court’s ruling in Loving v. Virginia declared anti-miscegenation laws that remained in 15 states unconstitutional.

sdt-2012-rise-of-intermarriage-01

America is much more racially and ethnically diverse than it was five decades ago.The once-illegal intermarriage now has reached a historical high. As of 2010, the share of all current marriages that are either interracial or interethnic reached an all-time high of 8.4%, and one-in-seven new U.S. marriages was between people of different races or ethnicities. Marriages between whites and non-whites are the most common types of intermarriage, which accounts for seven-in-ten (70%) new intermarriages in 2010.

The American public is more accepting of intermarriage as well. Nearly two thirds of Americans (63%) say they would be fine with a member of their own family marrying someone of a difference race, while only one-third of the public accepted intermarriage in 1986.

I will write more about intermarriage in future blog posts. Stay tuned!


3 Comments

News for All the Single Ladies

Americans are delaying marriage. The age at first marriage currently stands for 27 for women and 29 for men, according to the Census data presented in a recent report called “Knot Yet”. The report includes a lot of interesting findings about the benefits and the costs associated with delayed marriage. I tend to pay attention to details, when I get to Figure 7 and 15 (see below), some interesting patterns caught my eye: Never married women and never married men seem to be very different economically —judging by how well they are doing in comparison with their married peers.


Figure7

Among women in their mid-30s, those who have never married make more money than do married women. This is true at every education level. College educated single women have the highest personal income among this group of women, on average they make slightly over $50,000 per year.These findings have been adjusted by race/ethnicity, urbanity and region.

Never married men are less financially secure

On the other hand, the earning power of never married men in their mid-30s is weaker than that of their peers who are married. In fact, they consistently make less money than married men, at almost every education level.

What does this tell us? If income is a measure of success (not to say it is a good measure), the marriage market for those who wait until their mid-30s is largely made up with economically successful women and less successful men (Divorced and widowed adults are also on the market, although they are much less likely than those who have never married to say they want to get married, according to a report from the Pew Research Center).

Now it seems that some common complaints from single women are actually not far from the truth, such as “hard to find a quality man” or “all the nice (and successful) guys are married.” Sadly, now we have some evidence to back them up. It is not clear whether the highly paid men are more likely to get married or because of the marriage (as well as a supporting spouse), men increase their earning power. Both could be true. In fact, research has shown evidence supporting the relationship of  each direction. The challenge is that we will never know if the same group of men chose not to marry, what their earnings would be.

Another “news” that got confirmed in these data is that men on average still make more money than women, even when they are both single in their mid 30s and both college educated (the gap is approximately $10,000 per year).