Time and Life

by Wendy Wang


Leave a comment

The link between a college education and a lasting marriage

Originally posted on Pew Research Center “Fact Tank.”

ft_15-12-4-college-marriage2
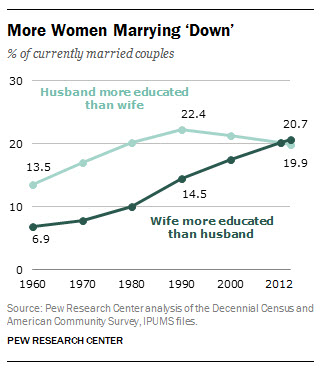
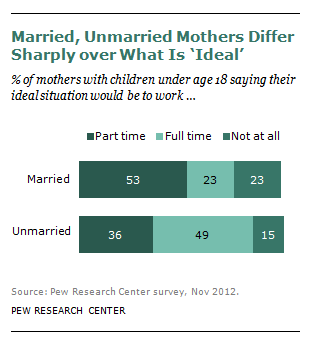
About half of first marriages in the U.S. are likely to survive at least 20 years, according to government estimates. But for one demographic group, marriages last longer than most: College-educated women have an almost eight-in-ten chance of still being married after two decades.

Researchers at the National Center for Health Statistics estimate that 78% of college-educated women who married for the first time between 2006 and 2010 could expect their marriages to last at least 20 years. But among women who have a high school education or less, the share is only 40%.

The probability of a lasting first marriage is derived from marital history data from the National Survey of Family Growth, a nationally representative sample of women and men who were ages 15 to 44 between 2006 and 2010. Estimates are based on an approach similar to that used to determine life expectancy and assume that marriage patterns in the future will follow patterns today. The findings refer only to opposite-sex marriages; the sample size was too small to analyze same-sex marriages.

Reasons for marriages ending include divorce and separation. Marriages that ended in death were not included in the analysis. One limitation of the survey was that it did not include adults over age 44 and therefore does not take into account long-term marriages that started later in life. And adults with advanced degrees were not separately analyzed because of the small sample size.

The findings are yet further evidence of the marriage gap in the U.S. along educational lines. College-educated adults are more likely to be married than less-educated adults. Among those who were ages 25 and older in 2014, 65% of those with a bachelor’s degree or more were married, compared with 53% of adults with less education, according to a Pew Research Center analysis.

While the research does not address reasons these marriages last longer, we do know college-educated adults marry later in life and are more financially secure than less-educated adults.

While more-educated women have the highest chances for a long-term marriage, college-educated men also stand out. Roughly two-thirds (65%) of men with a bachelor’s degree could expect that, if they marry, their first marriage will last 20 years or longer, compared with 50% of men with a high school diploma or less. In addition, men with a higher level of education are more likely to get married in the first place when compared with less-educated men.

ft_15-12-03-race_-marriageThere also are distinctive patterns in marriage longevity by race and ethnicity. Some of these differences could be related toeducational differences among adults with different racial or ethnic backgrounds. Asian women, who are among the most educated, are more likely than any other racial or ethnic group to have a long-term marriage. For Asian women who were married for the first time between 2006 and 2010, the chance that they may celebrate their 20-year wedding anniversary is nearly 70%. By contrast, about half of Hispanic and white women may see their marriages last that long. And for black women, the chance is 37%.

Among men, Hispanics have the highest likelihood of being in a long-lasting marriage (findings about Asian men are not included because the sample size was too small to be nationally representative). For those who married for the first time between 2006 and 2010, about six-in-ten Hispanic men (62%) could expect their marriages to last at least 20 years, compared with 54% of white men and 53% of black men.

ft_15-12-03-cohabitation-marriageAnother factor linked to long-lasting marriages is whether couples live together before tying the knot. In short, couples who lived together before getting married had a slightly lower chance of having a long-term marriage than those who did not live together.

Among women who did not live with their spouse before getting married for the first time, 57% can expect to still be married after 20 years. For women who lived with their spouse before marriage, the probability of being married for at least 20 years is somewhat lower – 46%. Whether the couple was engaged when they lived together didn’t make a difference in women’s chances of long-lasting marriages.

For men, the patterns are slightly different. In this case, it matters whether men are engaged to a partner they lived with before getting married. Men who lived with their future spouse without being engaged had a slightly lower chance of having a long-term marriage (49%) than those who were engaged first (57%). Men who didn’t live with their partner before getting married had a 60% chance of celebrating their 20th anniversary.


Leave a comment

The best and worst cities for women looking to marry

Originally posted on Pew Research Center “Fact Tank.”

Young adults who would like to get married naturally start looking for love in the community they live in, but in some parts of the country, the odds may be against them. A new Pew Research Center analysis finds pronounced differences in the ratio between men and women living in the largest U.S. metro areas, especially when it comes to singles who have an attractive characteristic: a job.

Our poll published earlier found that half (53%) of never-married Americans would like Top 10 Large Metro Areas With Highest Ratios of Employed Single Young Men to Single Young Womento eventually tie the knot. And among never-married women interested in marriage, 78% said that it is “very important” to them that a potential spouse has a steady job (only 46% of never-married men said the same). Looking at the most recently available census data, we explored the demographics of the “marriage market” based on what women said they want in a spouse.

Nationwide, single young men outnumber their female counterparts. The overall male-to-female ratio is 115:100 among single adults ages 25 to 34. But when we limit the young men to those who are currently employed, the ratio falls to 84 employed single men for every 100 single women. (We count both young adults who have never been married and those who have been previously married as single or unmarried.)

So, which large metro areas have the best “marriage market”? For women seeking a male partner with a job, our analysis found that San Jose, Calif., tops the list among large metro areas, with 114 single employed men for every 100 single women. Among all single young adults, there were 141 men for every 100 women in this area. Over half (57%) of young adults ages 25 to 34 in the metro area, which includes Sunnyvale and Santa Clara, were single in 2012.

(Our Mapping the Marriage Market interactive displays the results of all available U.S. metro areas, as well as the reverse ratios of employed women to men and all men to all women.)

Also high on the list is the Denver area. The male-to-female ratio is 121:100, and the ratio of employed men to all women is 101:100. Some 56% of young adults in this area were unmarried in 2012.

10 Large Metro Areas With Lowest Ratios of Employed Single Young Men to Single Young WomenBut even in these top metro areas, young women may find it difficult to find a young single man with a job. The Orlando, Fla., metro area has a sex ratio of 128 single young men to 100 single young women, but the ratio of employed young single men to all young women is only 90:100. The ratios are similar in Pittsburgh and Los Angeles.

A smaller pool of employed men may not be good news for young women who are looking for a man with a job, but it could be good news for young single men. At the opposite end of the demographic split, we calculated a list of the largest metro areas that have the lowest number of employed young men for every 100 young women.

Memphis, Tenn., tops this list: only 59 employed young single men for every 100 young single women. Some other metro areas in the bottom ten include Jacksonville, Fla.; Detroit, Mich.; Charlotte, N.C.; and Philadelphia, Pa.

Note: The metro ranking is based on 43 metro areas with more than 100,000 unmarried young adults ages 25 to 34. You can find a more complete list of metropolitan areas on our map.


Leave a comment

On weekends, dads find more time for leisure than moms

My latest contribution to the Pew Research Center’s blog- Fact tank.

It’s well documented that mothers do more child care and housework than fathers. But what about on the weekend, when both parents theoretically have more time for leisure?

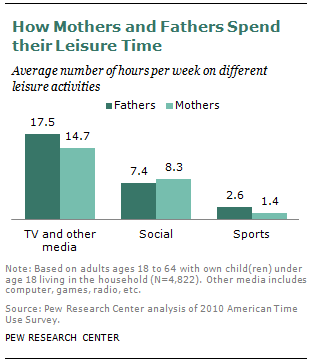
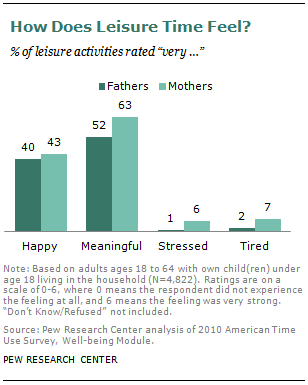
Our new analysis of time use data shows a striking change of pace for moms and dads on Saturday and Sunday. Mothers take a little break from child care (but not housework) on the weekend. Fathers pick up more housework, and the amount of time they devote to child care is a lot closer to mothers’ on the weekend.

But when it comes to leisure, fathers take full advantage of the weekends. The “leisure gap” between fathers and mothers, which is quite modest on the weekdays, grows to a one hour difference on Saturdays and Sundays.

On average, dads spend half the amount of time on child care that mothers do. But this is true only during the week. With moms scaling back their time for child care, fathers’ child-care time is about three quarters that of mothers’ (73%) on the weekends. On weekends, fathers step it up with housework, doing nearly an hour more than they do during the week. While fathers spend less than half as much time as mothers (46%) on the weekdays doing housework, they spend 71% the amount of time of mothers on the weekends.

Overall, on the weekends, mothers scale back their time spent on child care by 29%, compared with the amount of time spent during a week day (1.5 hours per day vs. 2.1 hours). This is consistent with earlier research by Sayer, Bianchi, and Robinson.

recent Pew Research Center report found that stay-at-home mothers spend more time on child care and housework than working mothers. But the gap in child care is much narrower on the weekends than during the week, and working moms spend almost the same amount of time on housework as stay-at-home moms do on the weekends.

Working moms tend to use the weekend to clean up the house: They increase their time spent on this activity by about one hour during the weekends. At the same time, stay-at-home moms take a little break from household chores on weekends. And all mothers, whether working outside the home or not, have more time for leisure activities during weekends.


Leave a comment

Record share of wives are more educated than their husbands

My latest contribution to the Pew Research Center’s blog- Fact tank.

DN_Marry_DownIt used to be more common for a husband to have more education than his wife in America. But now, for the first time since Pew Research has tracked this trend over the past 50 years, the share of couples in which the wife is the one “marrying down” educationally is higher than those in which the husband has more education.

Among married women in 2012, 21% had spouses who were less educated than they were—a threefold increase from 1960, according to a new Pew Research Center analysis of Census data.

The share of couples where the husband’s education exceeds his wife’s increased steadily from 1960 to 1990, but has fallen since then to 20% in 2012.

The trend toward wives being more educated than their husbands is even more prevalent among newlyweds, partly because younger women have surpassed men in higher education in the past two decades. In 2012, 27% of newlywed women married a spouse whose education level was lower than theirs. By contrast, only 15% of newlywed men married a spouse with less education. Among college educated newlyweds (including those with postgraduate and advanced degrees), nearly four-in-ten women (39%) married a spouse without a college degree, but only 26% of men did so.

DN_Share_DeclinesAnother important trend has to do with marriages between spouses with similar education levels. Even though college graduates are increasingly more likely to marry each other, the overall share of couples of similar education levels is down from nearly 80% in 1960 to about 60% in 2012.

The primary reason for the decline in the share of married couples with similar education levels is that marriages between spouses with high school or less than high school education are much less common these days — the share is down from 74% of all marriages in 1960 to 24% in 2012. In addition, adults with high school or less education are much less likely to marry. The marriage rate among this group plummeted —from 72% in 1960 to 46% in 2012.

Just the opposite has occurred among college graduates. The share of couples in which both spouses have a college degree has risen steadily in recent decades. In 1960, only 3% of couples were in this group, the share rose to 22% in 2012. Marriages between spouses with some college education were on the rise until 2000 (from 3% to 12%), but have leveled off since then.

Despite the rise of marriages between spouses with college degrees, only 22% of all newlyweds in 2012 were in this type of marriage. Another 19% were between spouses with a high school diploma or less. The share was 16% for newlyweds with some college education (but no bachelor’s degree).

Does marrying someone with less education mean “marrying down” economically? Not necessarily. When we look at the newlywed women who married someone with less education, we find that a majority of these women actually “married up.” In 2012, only 39% of newlywed women who married a spouse with less education out-earned their husband, and a majority of them (58%) made less than their husband.


5 Comments

Remembering Suzanne Bianchi

Suzanne M. Bianchi

Suzanne M. Bianchi

Suzanne M. Bianchi, my mentor in graduate school, passed away on Nov.4. She was only 61, diagnosed with pancreatic cancer in July, and left us only after a few months. Suzanne was one of the healthiest people I’ve ever known, her passing was sudden.

Suzanne was a distinguished scholar and a remarkable person. Her contribution to the field of time use and family demography has been far-reaching. NY Times, Washington Post, LA times, and many other news outlets have published nice tributes about her. Her online journal through caring bridge (run by her daughter Jen) has received more than 20,000 visits.

Suzanne has always been my role model. In addition to her successful career, she had a happy marriage and raised three children successfully. Family has always been her inspiration for research. She devoted her professional career to studying balancing work and family and gender equality. She set an example herself that “having it all” was possible.

UCLA Campus, Summer 2012

UCLA Campus, Summer 2012

Last July, I had a chance to visit Suzanne at the UCLA campus (she left Maryland and joined UCLA in 2009). This was the last time I saw her in person. It was a beautiful day. Suzanne showed me around the campus and took me to lunch at the faculty club. She felt like an old friend. She was excited about her new book and her new condo near the Santa Monica beach. We chatted about the changing demographic trends and how our own lives were affected. I said, “Suzanne, I think you have a perfect life.” “You know what? I actually agree with you” said Suzanne, with a smile on her face. It was a great moment.

Both being demographers, we know how American families have changed over time, and how challenging it is for a woman to balance work and family and to “have it all.” If there is anything I feel good about, it is the fact that Suzanne has achieved all, she has no regrets.

I am privileged to have Suzanne as my mentor during my six years of graduate school at the University of Maryland. Despite all the titles and awards she achieved, Suzanne was a very modest person. She treated everyone with respect, whether it was a first year student or a well-known scholar in the field.

Population Association of America conference 2011

Population Association of America conference 2011

Suzanne was a very supportive mentor. Her calmness and her kindness always comforted me. Being an international student, I was sometimes conscious about my English. Suzanne never made me feel that I was somehow different from other students. But Suzanne also understood International students’ challenges. I remember one spring, a Chinese girl in the department died (it was a tragedy). At the time many of us were at a conference, and we were shocked by the news. Suzanne saw me from a distance; she came up and gave me a big hug, asked: “Are you OK?” Simple words like this touched me. After all, it was not easy to leave family, travel thousands of miles and study in a foreign country.

Suzanne could be very tough as well. Honestly, my feelings for her were mostly fear during my time at Maryland. She had high standards and she demanded her students to do best work. My dissertation on father involvement was a tough project. It took me two years to finish. Suzanne asked me to test many different hypotheses and kept pushing me to do more and more. There was a time I felt like giving up (Glad I didn’t). I think she saw something there that was worth pursuing and she pushed. To this day, I still use her phrases on a daily base: “Past success predicts future” and “Deadline is the best strategy to get things done.”

Suzanne was very generous and she loved her students. Every time she traveled abroad, she brought back gifts for each of us. She took us out for lunch before the holidays and she gathered all of her students and bought us dinner at conferences. When her book “Changing Rhythms of American family life” was published, the publisher gave her some gift cards. She gave all the gifts cards to us, so that we each could buy $100 worth of books…

Graduation Ceremony, UMD, 2008

Graduation Ceremony, University of Maryland, 2008

While preparing this post, I found this card she gave me at my graduation ceremony in 2008:

“Dear Rong,
You did a fabulous dissertation, overcame health obstacles and were just an exemplary student. Now with an exciting job- you should be proud… as I am of you!
I look forward to being your colleague and hopefully collaborator- for a very long time. You make my job worth doing.
All the best,
Suzanne”

Tears have blurred my eyes when I am reading this. I only have two publications with Suzanne so far. I had hoped to be a collaborator for a very long time. Suzanne had high remarks of the work that Pew Research Center does, and she visited Pew a couple of years ago with some great ideas of collaboration. It is so sad that she left too soon…

Suzanne, you once said that your biggest “award” was to see your students finishing up and getting their Ph.D.s. I am so honored to have contributed to that award. Thank you for being a wonderful mentor and friend, for all the support that you’ve given me. I will carry on your legacy and continue studying families. After all, family is the most important thing of all–we start and end with it.

Here are my favorite news articles that featured Suzanne’s research:

Time magazine, August 8, 2011 “Chore Wars” (Cover story) (http://bccwf.wordpress.com/2011/07/29/chore-wars/)

The New York times, October 17, 2006, “Married and Single Parents Spending More Time With Children, Study Finds” (http://www.nytimes.com/2006/10/17/us/17kids.html?pagewanted=all&_r=0)

And some highlights of Suzanne work on gender, work and family issues:

Changing Rhythms of American Family Life (https://www.russellsage.org/publications/changing-rhythms-american-family-life)

Continuity and Change in the American Family (http://www.sagepub.com/textbooks/Book220814)

Balancing Act: Motherhood, Marriage, and Employment Among American Women (https://www.russellsage.org/publications/balancing-act )

American Women in Transition (https://www.russellsage.org/publications/american-women-transition)


Leave a comment

The “leisure gap” between mothers and fathers

In America, fathers, on average, have about three hours more leisure time per week than mothers. This “leisure gap” has been consistent at least over the past decade. What are dads doing with their extra time? For the most part, they’re watching TV, according to new Pew Research Center analysis of data from the government-sponsored American Time Use Survey (ATUS).

leisure 1There is a large body of research devoted to studying leisure time. Some studies like those of time-use experts John P. Robinson and Geoffrey Godbey, use a broader measure of “free time,” which is the time left over after subtracting all hours spent in paid work, housework, childcare, and personal care.  Other studies, such as one by Mark Aguiar and Erik Hurst in 2007, focus more narrowly on the time explicitly devoted to recreational activities or relaxation.

Using the narrower definition of leisure, our analysis of the 2010 ATUS data finds that fathers with children under age 18 in the household on average spend about three hours more leisure time than mothers (27.5 hours per week vs. 24.5 hours per week).

Most of the gap is found in front of the television set. Fathers spend 2.8 hours more each week than mothers watching TV or using other media. Fathers also spend more time playing sports or exercising than do mothers, while mothers spend more of their leisure time in social activities such as attending or hosting parties.

While there are gender differences in these different types of leisure activities, TV watching is a primary leisure activity for both parents. Fathers spend about 64% of their leisure time watching TV or using other media. For mothers, the share is 60%.

leisure 2The ATUS not only asks people how they spend their time but also how they feel while they’re engaged in particular activities. Our analysis of this data shows that mothers find their leisure time to be more meaningful than do fathers. Mothers rate 63% of their leisure activities “very meaningful,” while fathers give a similar rating to about 52% of their leisure activities. Meanwhile, mothers feel more exhausted than fathers during their leisure time, and their stress level associated with leisure time is higher as well.

The fact that mothers feel more stressed and tired than fathers even during their leisure may have to do with the way they experience their time. Mothers’ free time is often interrupted, which may make it hard for them to relax, according to a study by sociologist Suzanne Bianchi and others. Moreover, a study by Shira Offer and Barbara Schneider found that mothers tend to spend more time than fathers in multitasking, and the additional hours spent on multitasking are mainly related to time spent on housework and child care.

For more information on how the time use data is collected and the classification of leisure activities, see our report on modern parenthood and parents’ feelings about their time.

This post was originally published on Pew Research Center’s blog- Fact tank.


Leave a comment

How do single fathers balance work and family?

Single father1Single fathers are on the rise. Today, 8% of U.S. households with children under the age of 18 are headed by single fathers, up from 1% in 1960.

By definition, single fathers are not currently married and do not have a partner to help in raising their children in the household. In reality, single fathers often times are not “single”: about 41% of them live with an unmarried partner (the partner may or may not be mother of their children). If you are curious about the share for single mothers: about 16% of single mothers live with a cohabiting partner.

In this post I focus on the “real” single fathers who are not living with a partner and are the only parent in the household. I look at their time allocation at work and at home, and compare their time with that of married and cohabiting fathers, as well as that of single mothers. Most numbers are drawn from my analysis in an earlier report about modern parenthood.

Being mom and dad at the same time, one may think that single fathers carry a heavier workload than married fathers. However, the time diary data suggest that this is not the case.

Compared with fathers who are married or living with a partner, single fathers spend more time doing housework (averaging 10 hours per week), but less time in childcare (6 hours per week). Single fathers’ time in paid work is less than that of married fathers, but more than that of cohabiting fathers.

If we add up the time in all three types of work (paid work, childcare, and housework), single fathers’ total workload per week is about 50 hours, which is higher than that of cohabiting fathers (48 hours), but lower than that of married fathers (55 hours).

Compared with married fathers, single fathers are less likely to have a college education (35% vs. 15%), and their employment rate is lower as well (89% vs.78%). Single fathers tend to have somewhat older children than do married or cohabiting fathers, which may help to explain why single fathers’ childcare time is slightly less than that of fathers in other family types.

Single father2

Single fathers work as hard as single mothers, judging by their total workload. Each group spend an average of 50 hours per week in all work-related  activities including paid work, childcare and housework, although their time allocation is somewhat different. Single fathers spend longer time in paid work than do single mothers (34 hours vs. 24 hours per week), but their time in childcare is half of what single mothers engage in (6 hours vs. 12 hours per week), and their housework time is lower as well (10 hours vs. 14 hours per week).

Still, single fathers manage to have four more hours of  leisure time per week than do single mothers.


Leave a comment

Mothers and work: What’s ‘ideal’ ?

Originally posted at Pew Research Center-Fact Tank blog.

FT_Mothers_Prefs

For most American mothers, part-time work would be their ideal work situation, preferred over full-time work or not working at all outside the home. However, there are sharp differences among views of mothers based on factors such as economic circumstances and marital status.

At Pew Research, we have tracked people’s work preferences since 1997. The question we ask is: “Considering everything, what would be the ideal situation for you — working full time, working part time, or not working at all outside the home?”

Working part time has consistently been the top choice for women with at least one child under the age of 18 in the three years that the question was asked. Nearly half of mothers (47%) in 2012 said that their ideal situation would be to work part time. The share was 50% in 2007 and 44% in 1997.

Among mothers who currently work full time, many would rather not. About 44% say that working part time would be their ideal situation, 9% say not working outside the home would be ideal. Only about half (46%) of full-time working mothers consider their current situation ideal.  

On the other hand, mothers who are not employed also think working part time is appealing. Fully four-in-ten say part-time work would be the ideal situation for them, 22% think working full time would be ideal, and 36% are happy with their current situation.

The way mothers view their ideal work situation has fluctuated somewhat over time, and these changing preferences likely reflect changing economic circumstances. The share of mothers preferring full-time work increased sharply between 2007 and 2012 (from 20% to 32%) – an intervening period that included a severe economic recession.

Mothers at the lower end of the income scale are much more likely than more affluent mothers to say that working full time would be the ideal situation for them. In 2012, some 40% of mothers with annual family incomes of less than $50,000 said full-time work would be ideal, compared with 25% of mothers with incomes of $50,000 or higher.

FT_Married_Unmarried
The 2012 Pew Research survey also found that single mothers were much more likely than married mothers to say their ideal situation would be to work full time. Single mothers, often the sole provider in their household, have a much lower family income than married mothers, on average. It’s not surprising, then, that among unmarried mothers, nearly half (49%) say that their ideal situation would be to work full time, while 36% say part-time work would be ideal. In contrast, married mothers see part-time work (53%) as more desirable than full-time work (23%). The gap in views between married and unmarried mothers has widened significantly since 2007, when these two groups of mothers had more similar views about their ideal work situation.

What mothers see as ideal for themselves is similar to what the general public thinks about women with young children. In the same 2012 survey, we asked the public about the ideal situation for women with young children. Nearly half (47%) of the public said that working part time is the ideal situation for women with young children, 33% said not working outside the home is ideal, and another 12% said working full time would be ideal.

However, when asked about what is the ideal situation for men with young children, a vast majority of the public (70%) says that full time work is ideal. One-in-five think working part time is ideal for fathers, and only 4% say it is ideal for fathers of young children not to work outside the home.

More generally, the public remains conflicted about the impact that women working for pay outside the home has on family life. Most say there are clear economic benefits for families, yet most also say the increasing number of women working for pay has made it harder for parents to raise children. And many say this has made it harder for marriages to succeed.

With all the recent discussion about opting out, leaning in and breadwinner moms, these data serve as an important reminder that many factors go into a mother’s decision about whether and how much to work for pay outside the home.


Leave a comment

Seven facts about intermarriage

sdt-2012-rise-of-intermarriage-05sdt-2012-rise-of-intermarriage-06sdt-2012-rise-of-intermarriage-02
1. Most intermarriages happen between whites and non-whites in the U.S.. In 2010, seven-in-ten (70%) new intermarriages involved a white spouse. The most common pairings were between whites and Hispanics. They accounted for more than four-in-ten new intermarriages in 2010. The share of White/Asian couples was 14%, and white/black couples 12%.

2. Asian Americans has one of the highest intermarriage rates. In 2010, 28% of newly married Asians “married out,” compared with 26% of Hispanic newlyweds, 17% of black and 9% of white newlyweds. If we look at all currently married couples (regardless of when they got married), the intermarriage rate is 15% for Asians, 18% for Hispanics, 10% for blacks and 5% for whites. The Asian intermarriage rate has gone down somewhat in recent years.

3. Black men are more than twice as likely as their female counterparts to marry a non-black spouse, but the reverse gender pattern is true among Asian Americans. In 2010, nearly one quarter of black male newlyweds (24%) married outside their race, compared with just about 9% of black female newlyweds. In contrast, more than one-in-three (36%) Asian female newlyweds in 2010 married someone who is non-Asian, compared with only about one-in-six Asian male newlyweds (17%).

4. “Marrying out” is much more common among the native-born population than among immigrants. Native-born Hispanics were nearly three times as likely as their foreign born counterparts to marry a non-Hispanic in 2010.The disparity among native and foreign-born Asians is not as great, but still significant: More than one-in-three (38%) native-born Asians and nearly a quarter (24%) of foreign-born Asians married a non-Asian in 2010.

5. White/Asian intermarried couples have the highest earning power. The combined median earnings of white/Asian newlywed couples are nearly $71,000, much higher than earnings of white/Hispanic couples (about $58,000) and white/black couples (about $53,000). White/Asian couples have higher combined earnings than do white/white or Asian/Asian couples.

Much of the earning gaps among couples can be linked to educational differences. In about four-in-ten intermarried white/Asian newlyweds (41%) both husband and wife are college educated, compared with 23% of white/white couples, 19% of white/Hispanic couples, and 15% white/black couples. (Asian/Asian couples are the most educated, but their combined earnings are somewhat lower than white/Asian couples).

6. First-time newlyweds (for both bride and groom) made up about 58% of all newly married couples between 2008 and 2010. About one-in-five (20.5%) new marriages were for couples that both bride and groom have been married before, and the rest involved one married before, one not.

The vast majority of Asian and Hispanic couples who “married in” are the first time newlyweds (79% and 68%). The rate for intermarried white/Hispanic and white/Asian couples is lower, about six-in-ten (59%). First-time marriage rate for white/white couples is slightly lower (55%), and a similar rate applies to black couples and intermarried white/black couples (about 54%).

7. Intermarriage in the Unites States tilts West. About one-in-five (22%) of all newlyweds in Western states married someone of a different race or ethnicity between 2008 and 2010, compared with 14% in the South, 13% in the Northeast, and 11% in the Midwest.

At the state level, more than four-in-ten (42%) of newlyweds in Hawaii between 2008 and 2010 were intermarried; the other states with an intermarriage rate of 20% or more are all situated west of the Mississippi River. For marriages between whites and Hispanics, the three states with the highest prevalence rates are New Mexico (19%), Arizona (12%) and Nevada (11%). The highest shares of intermarried white and Asian couples are in Hawaii (9%), District of Columbia (7%), and Nevada (5%). And the top three states for white/black intermarried couples are: Virginia (3.3%), North Carolina (3.2%) and Kansas (3.0%).


Leave a comment

For Young Adults, the Ideal Marriage Meets Reality

An earlier version was posted at Pew Research Center-Fact Tank blog.

young-adults-dual-income-marriage

Americans’ attitudes toward an ideal marriage have changed dramatically over the past several decades. The share of the public that favors a marriage in which husband and wife both work and take care of the house and children is up from 48% in 1977 to 62% in 2010. During the same period, the share that prefers the model of the breadwinner husband and homemaker wife is down from 43% to 30%.

Young adults are often at the forefront of changing social norms. Adults younger than 30 are most likely to favor a dual-income marriage model (72%), over the breadwinner husband-homemaker wife model (22%). This is even more true for young women, who are more likely than young men to prefer dual-income marriage (78% vs. 67%). Young adults are also more positive about the impact on families of increasing numbers of women entering the workforce.

Given young adults’ strong preference for a dual-income marriage model and their positive attitudes about working women, we might expect that they would be more likely to embrace the dual-income model when they themselves are married.

However, it’s not the case. When we took a closer look at the most recent American Community Survey data, we found that 57% of young married couples (where the wife is younger than 30) are in a dual-income marriage, compared with 62% of couples in their 30s and 40s. These young couples also are more likely than older ones to include a breadwinner husband and homemaker wife (32% do).

Dual-income-marriages-wife-ageBreadwinner-husband-homemaker-wife

Why is that? The answer appears to be related to the age of their children. More than half of young couples (57%) have children ages 5 or younger at home, compared with 30% of couples in their 30s and 40s. (Young couples in general are less likely than couples in their 30s and 40s to be parents.)

Younger children create greater time demands on their parents. According to our analysis of 2011 time diary data, overall, parents with children younger than 18 spend an average of 11 hours per week on childcare, but 15 hours per week when they have children younger than 6.

Cost of childcare is another factor. In big metro areas, good professional childcare can be expensive and it may make more economic sense to have one spouse staying at home full time than putting kids in daycare.

Even though many of today’s young couples don’t yet have the kind of egalitarian marriage they say they want, they’re closer to that ideal than their same-aged counterparts were a generation ago (in 1980). Back then, 51% of married couples under the age of 30 had dual incomes, compared with 57% now.